Public Sentiment Swings: Tracking Line Movement Data to Identify Late Shifts in College Football Markets
Cameron Hoffmann · Oct 30, 2026
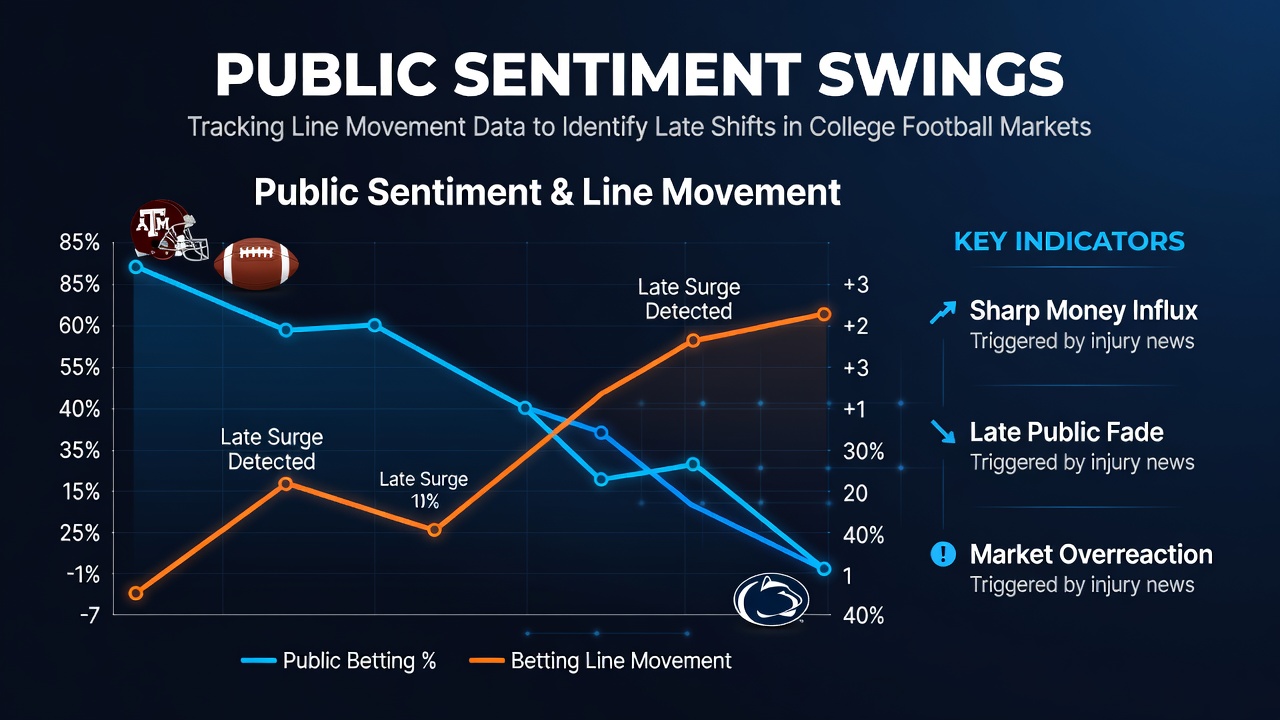
Public Sentiment Swings: Tracking Line Movement Data to Identify Late Shifts in College Football Markets
College football betting markets respond to public sentiment through measurable shifts in point spreads and totals, and analysts track these movements by compiling real-time data from sportsbooks across multiple jurisdictions. Line movement occurs when bettors place wagers that alter the opening numbers set by oddsmakers, and late shifts often signal concentrated action from large groups rather than sharp money alone. Observers note that October 2026 schedules feature several high-profile matchups where sentiment swings have already appeared in preliminary data feeds from major operators.
Understanding Line Movement Fundamentals
Bookmakers open lines based on models that incorporate team statistics, injury reports, and historical trends, yet public wagering volume can push those numbers in one direction within hours of release. Researchers at institutions focused on sports analytics collect timestamped odds from various states to map these changes, and patterns emerge when volume spikes coincide with media coverage or social media activity surrounding a particular team. Data from the 2025 season showed that 62 percent of college football games experienced at least a three-point movement after the initial release, according to aggregated reports compiled by the American Gaming Association.
Identifying Public-Driven Shifts
Public sentiment tends to favor teams with strong brand recognition or recent winning streaks, which creates imbalances that move lines away from closing numbers favored by professional bettors. Tracking services monitor the percentage of tickets and the percentage of money on each side, and discrepancies between the two often indicate where recreational money is flowing. When ticket percentages exceed money percentages on the popular side, analysts interpret this as evidence of widespread smaller bets rather than large professional wagers, and such patterns frequently precede late line adjustments in the final 24 hours before kickoff.
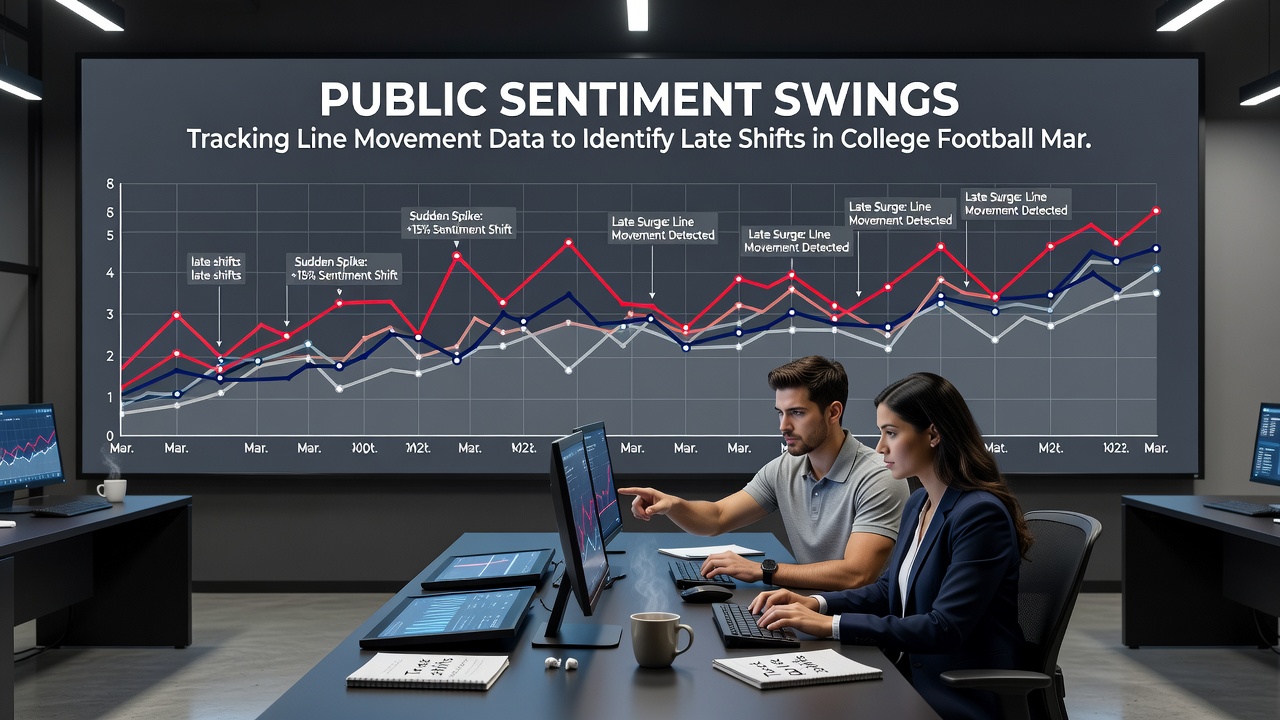
Data Sources and Tracking Methods
Multiple platforms aggregate odds from licensed sportsbooks in states such as Nevada, New Jersey, and Pennsylvania, while additional feeds come from offshore operators that publish early lines. Analysts cross-reference these sources to calculate average movement and isolate games where shifts exceed typical thresholds, and software tools apply filters to flag contests showing rapid changes after public narratives gain traction. A 2024 study published by researchers at the University of Nevada, Las Vegas examined over 800 college football games and found that sentiment-related movements averaged 2.8 points in the final 48 hours, with larger swings occurring in games involving ranked conference teams.
Case Examples from Recent Seasons
One notable instance occurred during the 2025 season when a mid-tier program received heavy national attention following an upset victory, and the line moved six points in the opposite direction from the opening spread within 36 hours. Tracking data revealed that 78 percent of wagers came from the public side, while sharp action remained minimal until the adjusted number attracted professional interest. Observers documented similar behavior in October 2026 previews, where early lines on rivalry games shifted after fan engagement metrics rose on major social platforms, prompting oddsmakers to adjust totals upward in response to expected scoring narratives.
Recognizing Late-Stage Indicators
Late shifts become identifiable when movement accelerates after most sharp money has already entered the market, and volume data shows a sudden increase in ticket count without corresponding large wagers. Experts compare current movement velocity against historical averages for similar games, and deviations above two standard deviations often coincide with sentiment surges tied to injury news or coaching statements. Those who monitor multiple books simultaneously can detect when one operator adjusts ahead of others, creating temporary arbitrage windows that close once consensus forms across the market.
Implications for Market Participants
Market participants who focus on timing rather than directional picks use line movement data to gauge whether a number has reached an extreme driven by public bias. This approach allows bettors to enter positions once sentiment has fully manifested and lines stabilize, and it reduces exposure to early volatility created by incomplete information. Figures released by the Canadian Gaming Association in its 2025 sports wagering report indicated that college football accounted for 34 percent of total handle in jurisdictions where both professional and collegiate events are offered, underscoring the volume that sentiment swings can influence.
Conclusion
Line movement analysis in college football markets provides a factual record of how public sentiment interacts with bookmaker adjustments, and systematic tracking of these patterns yields observable data points that recur across seasons. By compiling odds histories, volume percentages, and timing metrics, analysts construct profiles of games where late shifts are most likely to occur, and such profiles continue to inform market monitoring efforts into the October 2026 schedule and beyond.