Tracking Volatility in Spread Betting Markets During Major Snooker Championships
Cameron Hoffmann · Aug 19, 2026
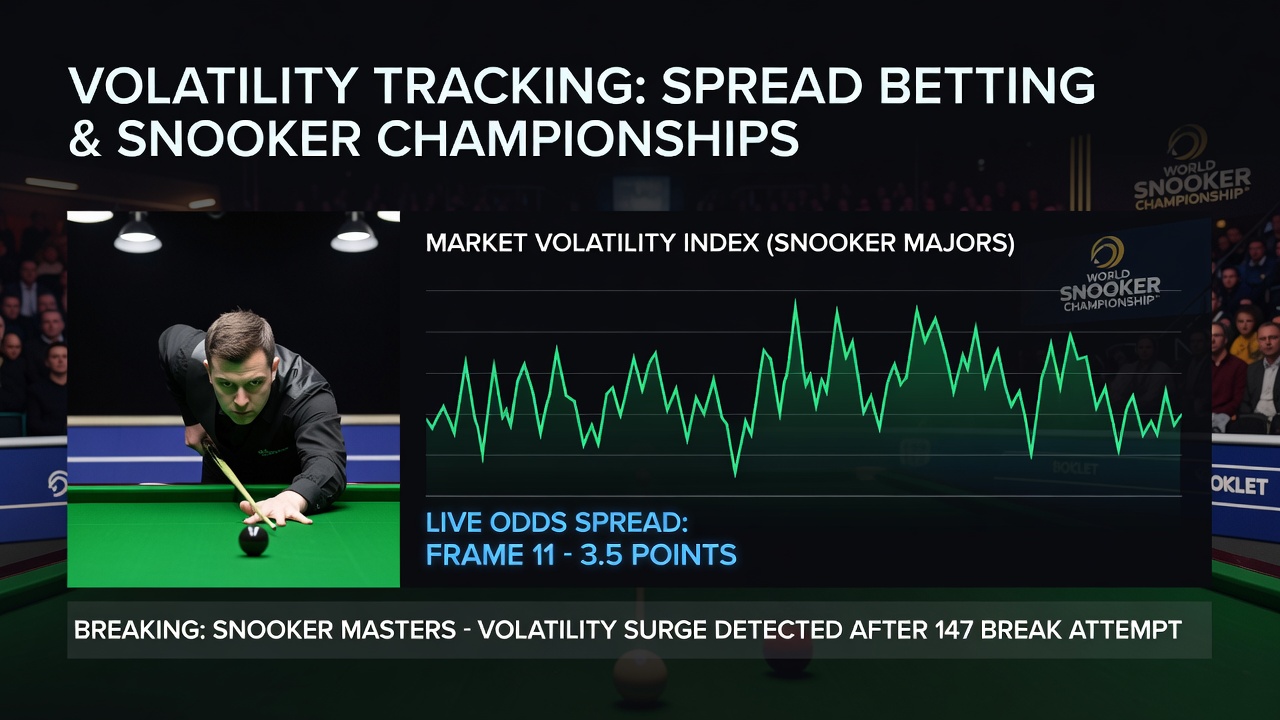
Tracking Volatility in Spread Betting Markets During Major Snooker Championships
Spread betting markets in snooker revolve around performance margins such as frame differences, total points scored, and highest break thresholds, and these markets show distinct volatility patterns during major championships like the World Snooker Championship and the UK Championship. Observers note that spreads widen and contract rapidly when players deliver unexpected breaks or when matches extend into deciding frames, while data from past events indicates that volatility peaks during the quarter-final and semi-final stages when stakes and audience interest intensify.
Core Mechanics of Snooker Spread Betting
Spread betting allows participants to wager on the extent to which a player exceeds or falls short of a quoted spread rather than simply predicting a win or loss, and this structure creates continuous price movement throughout each session. Researchers have documented that bookmakers adjust spreads in real time based on live scoring data, with adjustments often occurring after every frame when cumulative points alter projected match totals. Those who track these shifts find that frame-by-frame updates introduce short-term spikes because a single century break can push a player several points beyond the initial spread, forcing immediate repricing across related markets.
Primary Drivers of Market Volatility
Player form fluctuations, table conditions, and referee decisions all contribute to spread movement, yet the dominant factor remains the occurrence of high-scoring breaks that exceed statistical averages. Data shows that during the 2024 and 2025 World Snooker Championship tournaments, spreads on total points markets moved by an average of 18 points within the first three frames of any given match when at least one player compiled a break over 80. Tournament scheduling also plays a role because evening sessions attract higher betting volumes that amplify price sensitivity, while morning sessions exhibit steadier spreads due to lower liquidity.
Analytical Tools and Data Sources
Market participants rely on statistical platforms that aggregate historical break frequencies and session averages to model expected volatility ranges, and these tools incorporate variables such as player age, recent tournament results, and head-to-head records. Figures reveal that incorporating real-time shot success rates reduces forecast error by approximately 12 percent compared with models that use only pre-match data. External analysis from the Australian Gambling Research Centre highlights similar patterns across cue sports, where live data feeds allow quicker identification of mispriced spreads during extended rallies.
Additional monitoring comes from exchange platforms that display depth-of-market information, revealing when large positions begin to influence quoted spreads. Those who follow order-flow patterns observe that volatility often subsides after the midpoint of a best-of-25 match because remaining frames become more predictable once one player establishes a lead. In contrast, best-of-11 formats common in earlier rounds maintain higher volatility throughout because fewer frames leave less room for recovery.

Seasonal Patterns and August 2026 Outlook
Although the traditional snooker calendar concentrates major events between November and May, preparatory data collection for the 2026 season begins in August when players participate in exhibition events and training camps. Records indicate that volatility metrics derived from these off-season matches provide baseline comparisons that help analysts calibrate spreads once the official championship schedule resumes. Reports compiled by the International Betting Integrity Association show that early-season form indicators from August exhibitions correlate with opening-week spread stability in the subsequent World Championship qualifiers.
Case Examples from Recent Championships
During the 2025 UK Championship, one semi-final match saw the spread on highest break move from 85 to 112 points within a single session after consecutive centuries, demonstrating how quickly liquidity providers must respond to outlier performances. Another documented instance occurred in a quarter-final where a player overcame a three-frame deficit, causing frame-difference spreads to reverse direction three separate times before the match concluded. Analysts tracking these movements note that such reversals create temporary arbitrage opportunities when correlated markets on total frames and total points fail to adjust at the same pace.
Conclusion
Tracking volatility in snooker spread betting markets requires continuous integration of live scoring feeds, historical performance databases, and order-flow indicators, and the process becomes especially pronounced during major championships where match length and prize money amplify every scoring swing. Data collected across multiple seasons confirms that systematic monitoring of break frequency and session timing allows for more accurate anticipation of spread adjustments, while August preparatory events supply useful calibration points ahead of the main 2026 campaign. Observers continue to refine models that combine these elements to follow price movements as they develop frame by frame.